One dependency for logs, traces and metrics: writing a Spring Boot starter
Every service wires observability slightly differently, and the differences show up during incidents. How I packaged logging, tracing and metrics into one Spring Boot starter — and three gaps a code review of my own starter found.
The worst time to discover that your services log differently is during an incident. It happens easily: each service is set up by a different person at a different time, so you end up with different field names, trace IDs in some services but not others, and a correlation ID that stops at the first hop. In a platform with several services I’ve worked on, the answer was a shared module for logging, auth and tracing; this starter is that idea rebuilt in the open.
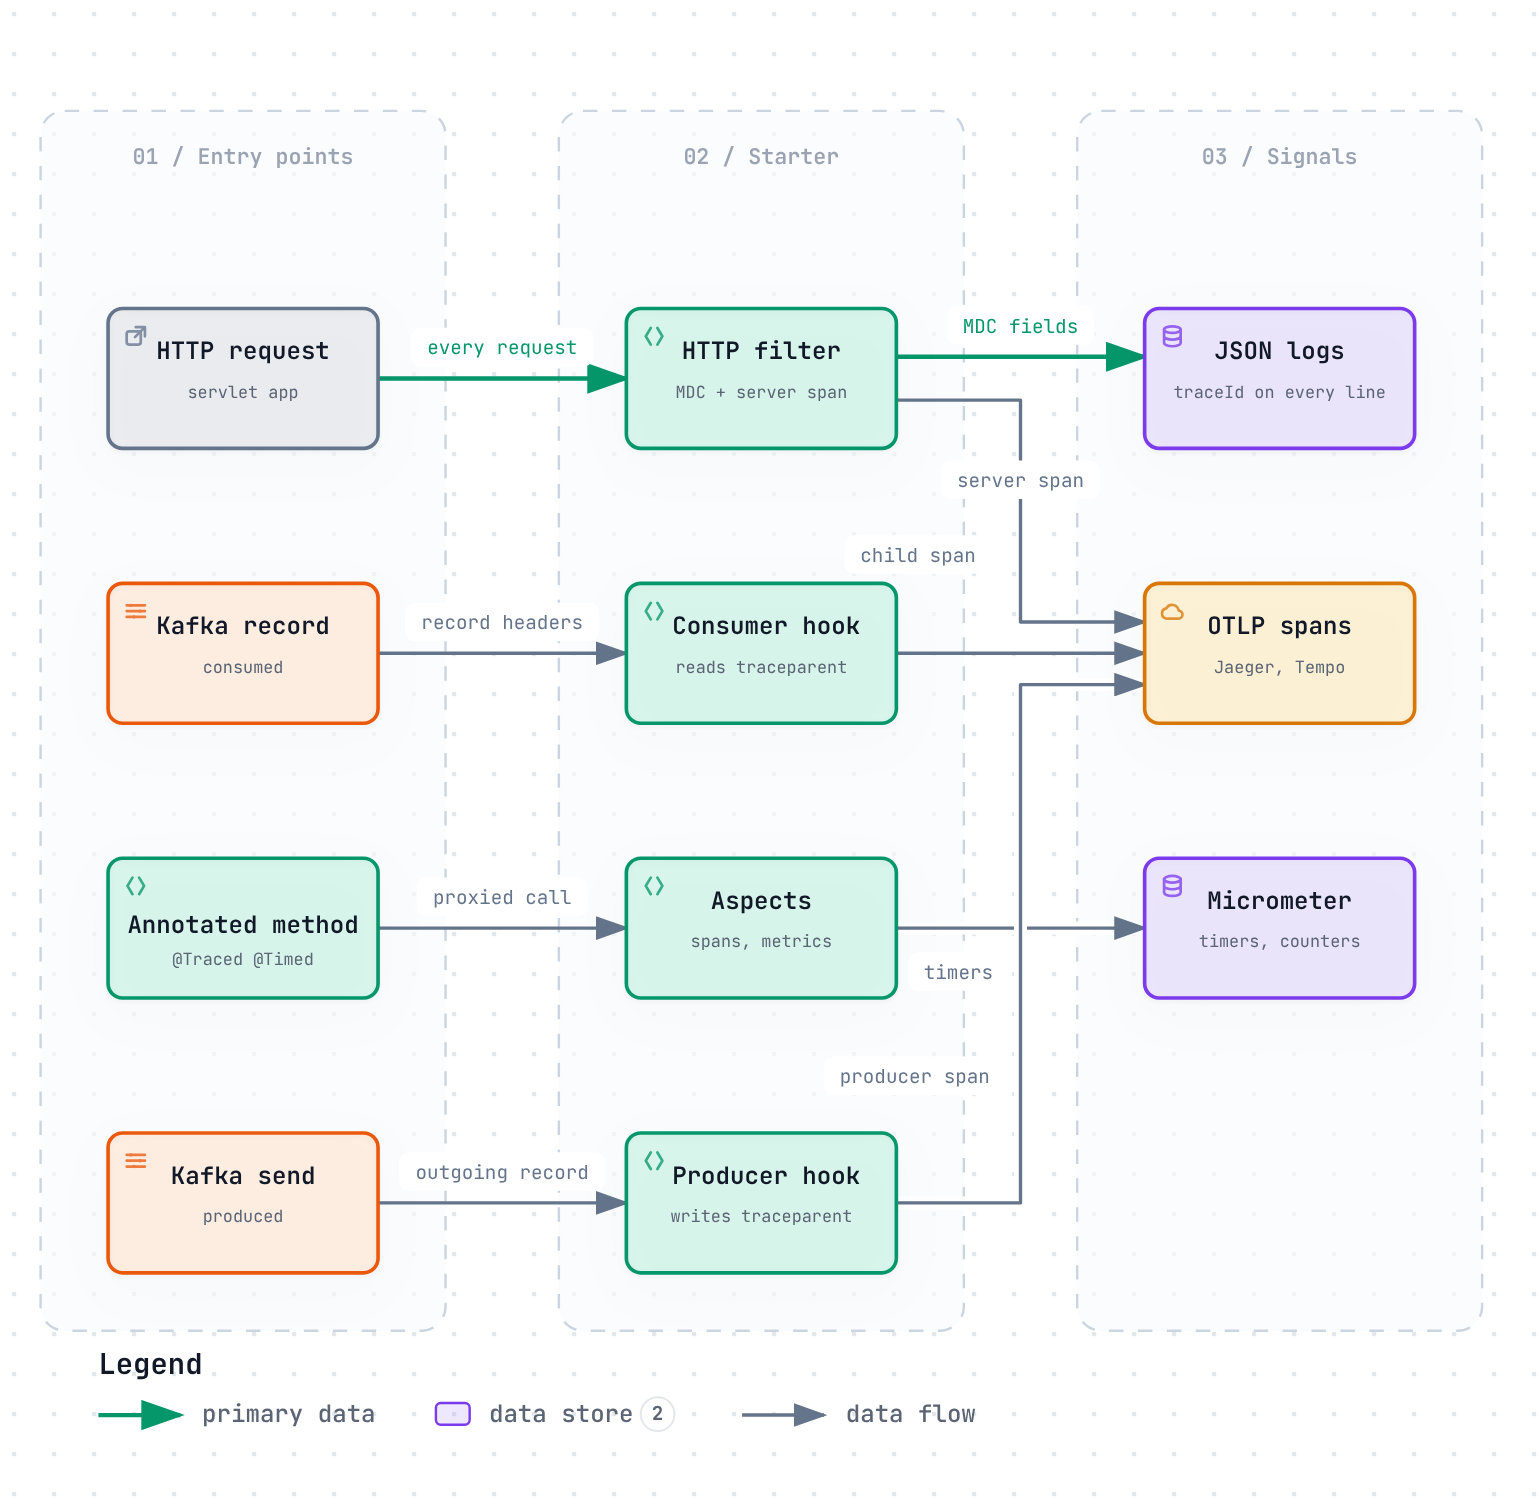
The fix isn’t a wiki page of conventions. It’s making the right setup the default by putting it in a dependency. That’s what spring-boot-starter-observability does: add one dependency to a Spring Boot 3 app and you get:
- Structured JSON logs with
traceId,spanId,requestIdandcorrelationIdon every line. - OpenTelemetry tracing: a server span per HTTP request, spans across Kafka producers and consumers using the W3C
traceparentheader, and@Tracedfor any method. - Micrometer metrics: JVM metrics plus
@Timedand@Countedon any method, and a health indicator. - Correlation IDs that cross service boundaries via
X-Correlation-Id.
What a starter actually is
A Spring Boot starter is two small ideas:
- A list of auto-configuration classes in
META-INF/spring/org.springframework.boot.autoconfigure.AutoConfiguration.imports, which Spring Boot loads at startup. - Those classes create beans only when it makes sense, using
@Conditional...annotations.
The project is split the way the Spring team splits its own starters:
| Module | Role |
|---|---|
starter-core |
Annotations (@Traced) and constants; no auto-configuration |
starter-autoconfigure |
Logging, tracing and metrics auto-configuration |
starter-sample |
A product API that shows everything working |
Rule 1: every bean backs off
The most important annotation in a starter is @ConditionalOnMissingBean. If the application defines its own SpanExporter or SdkTracerProvider, the starter’s version quietly steps aside:
@AutoConfiguration
@ConditionalOnClass({OpenTelemetrySdk.class, OtlpGrpcSpanExporter.class})
@ConditionalOnProperty(prefix = "observability.tracing", name = "enabled",
                       havingValue = "true", matchIfMissing = true)
public class ObservabilityTracingAutoConfiguration {

    @Bean
    @ConditionalOnMissingBean
    public SpanExporter otlpGrpcSpanExporter(ObservabilityProperties properties) { ... }
}
Each piece is also gated on the classpath and on a property. Kafka tracing only appears when Kafka’s interceptor classes are present and a Tracer bean exists; the servlet filter and MVC interceptor only appear in servlet web applications. A starter that forces beans on you gets ripped out within a quarter.
Rule 2: observability never stops the app
If the trace collector is down, your service should still serve traffic. If the exporter can’t even be built — a malformed endpoint, say — the auto-configuration catches the failure, logs a warning and returns a no-op exporter:
} catch (Exception e) {
    log.warn("Failed to initialize OTLP span exporter (endpoint: {}). " +
             "Traces will not be exported: {}", tracingProps.getEndpoint(), e.getMessage());
    return SpanExporter.composite(); // no-op: the app starts, spans are discarded
}
When the collector is simply unreachable at runtime, the OpenTelemetry SDK exports in the background and drops what it can’t send. Either way, requests keep flowing.
Logs that carry the trace
RequestContextFilter runs once per request and fills the SLF4J MDC, so every log line written while handling the request carries the same identifiers:
String correlationId = request.getHeader("X-Correlation-Id");
if (correlationId == null || correlationId.isBlank()) {
    correlationId = UUID.randomUUID().toString();
}
MDC.put("correlationId", correlationId);
response.setHeader("X-Correlation-Id", correlationId);
Everything is cleared in a finally block — without that, values leak into the next request that reuses the pooled thread, which produces some of the most confusing logs you’ll ever read.
The filter is configurable with properties (include-headers, header-filter, custom-fields) so a team can, for example, add tenantId to every line without writing code.
Tracing across Kafka
HTTP has standard instrumentation in most stacks; message queues are where traces usually break. The producer interceptor writes a W3C header onto each record:
// version-traceId-spanId-traceFlags
String traceparent = "00-" + traceId + "-" + spanId + "-" + traceFlags;
record.headers().add("traceparent", traceparent.getBytes(StandardCharsets.UTF_8));
The consumer interceptor reads it back and starts a child span, so a trace that begins with an HTTP request continues through the topic into the consumer. In Jaeger you see one trace across both services instead of two unrelated ones.
Three gaps I found reviewing my own starter
I re-read the code as if it were someone else’s pull request. Three findings:
- HTTP spans don’t continue the caller’s trace. The tracing interceptor starts the server span with
setParent(Context.current()), but nothing extracts an incomingtraceparentheader first. Kafka hops are linked; HTTP hops start a new trace. The fix is to run the OpenTelemetryTextMapPropagatorover the request headers before starting the span. - Two different trace IDs. The log filter takes its
traceIdfrom anX-Trace-Idheader (or falls back to the request ID), while spans have OpenTelemetry’s own trace ID. Logs and traces should share one ID; the filter should read it from the current span. http.routeuses the raw URI./products/123and/products/456become different routes, which explodes metric cardinality. It should use Spring’s matched pattern (/products/{id}).
None of these show up in a demo. All three show up in production, during the incident you built the starter for. Fixes are the next commits.
Takeaways
- Put conventions in a dependency, not a document.
- In a starter,
@ConditionalOnMissingBeanis a feature: let teams override anything. - Observability failures must degrade to “no data”, never to “no service”.
- Trace propagation is only as good as its weakest hop — test every protocol your services speak.
Code, tests and the sample app are on GitHub.